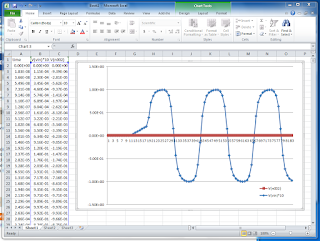
LTSpice waveform data can easily be exported for use in other graphing software like Excel.
To do this:
Step1: Run simulation, select File -> export
Step2: Select the traces of interest
Step3: A text file is saved in the LTC->LTSpiceIV root directory, the title will be "Draft1" by default or enter a desired file name.
Step4: Open the text file in Excel, or cut/paste from the text file
6 comments:
I really enjoyed reading your post.
Thanks for this post. It Very nice Blog.
It was a very good Blog. I like it. Thanks for sharing knowledge.
Ask you to share good Blog again.............
excel interpolation function
Thank you for this! I really needed this to identify a system (get a Transfer function from it) and had no idea how to. This + Matlab will make it very easy!
Would be nice and useful, but not on the mac version. Figures!!...
Sharing data from the Mac version can be achieved!
From the wave viewer
open the 'control panel' (icon is a hammer)
on the 'Waveforms' tab the data export tool can be accessed via a button marked 'Data Export Tool'.
Hope this helps
This does not seem to work with version 4.23j. I get an exported text file but if I import that into a spreadsheet and plot it I get a distorted plot. This seems to be because the X axis data does not increment smoothly. It actually seems to be a quantised sampling staircase.
In the Windows version running under Wine on Linux I see no 'Data Export Tool', the only Export option is in the 'File' menu.
My previous post describes what happens when I try to export waveform data. If I follow the same procedure for a frequency response plot I can reproduce a sensible looking curve in a spreadsheet program.
Post a Comment