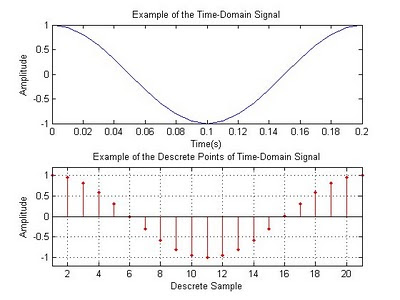
The script below will get you started plotting basic time domain signals. The following tutorials are available on additional DSP topics:
- DSP Tutorial #1: Basic Plots
- DSP Tutorial #2: Signal Creation
- DSP Tutorial #3: Sum of Sinusoids
- DSP Tutorial #4: Complex Signals
- DSP Tutorial #5: Frequency Analysis
- DSP Tutorial #6: Looping
- DSP Tutorial #7: Audio Processing
- DSP Tutorial #8: Spectrum Function
- DSP Tutorial #9: Basic digital filter
- DSP Tutorial #10: Windowing
This is a simple Matlab script which describes the basic plotting of time-domain signals.
%% DSP Tutorial Script
% James Eastham
% Member, IEEE
% Created on: 01/08/2010
% Revision: R1
%% Plotting a Basic Time Domain Signals
% Sinewave with a peak amplitude of 1 and a fequency of freq
clear all;
close all;
freq = 5; %5Hz
n=0:.01:.2; %number of discrete values on X axis
x = cos (2*pi*freq*n); %our cosine signal
figure('Color',[1 1 1]);
plot(n,x);
title('Example of Tim-Domain Signal');
xlabel('Time(s)');
ylabel('Amplitude');
%% Plotting a Basic Time Domain Signal Continued
figure('Color',[1 1 1]);
stem(n,x,'--rs','LineWidth',2,'MarkerEdgeColor','k','MarkerFaceColor','g','Markersize',10);
hold on;
plot(n,x);
title('Example of Time-Domain Signal Plot');
xlabel('Time(s)');
ylabel('Amplitude');
%% Plotting with the Subplot Feature
% subplot(m,n,p) breaks the figure window into an
% m-by-n matrix
figure('Color',[1 1 1]);
subplot(2,1,1);
plot(n,x);
title('Example of the Time-Domain Signal');
xlabel('Time(s)');
ylabel('Amplitude');
ns=1:length(n);
subplot(2,1,2);
stem(ns,x,'.r');
title('Example of the Descrete Points');
xlabel('Descrete Sample');
ylabel('Amplitude');
axis([1 21 -1.2 1.2]);
grid on;
1 comment:
Post a Comment